Business Reporting Using Power BI Training


Business Reporting Using Power BI Training
Order this unique E-Learning Training Business Reporting Using Power BI online, 1 year 24/7 access to rich interactive videos and tests.
Read more- Brand:
- Microsoft
- Discounts:
-
- Buy 2 for €146,02 each and save 2%
- Buy 3 for €144,53 each and save 3%
- Buy 4 for €143,04 each and save 4%
- Buy 5 for €141,55 each and save 5%
- Buy 10 for €134,10 each and save 10%
- Buy 25 for €126,65 each and save 15%
- Buy 50 for €119,20 each and save 20%
- Availability:
- In stock
- Delivery time:
- Ordered before 5 p.m.! Start today.
- Award Winning E-learning
- Lowest price guarantee
- Personalized service by our expert team
- Pay safely online or by invoice
- Order and start within 24 hours


Business Reporting Using Power BI E-Learning
Order this unique E-Learning course "Business Reporting Using Power BI" online!
✔️ 1 year of 24/7 access to rich interactive videos, voice instructions, progress tracking through reports, and chapter-based tests to immediately assess your knowledge.
Why choose this training?
In a data-driven world, effective business reporting is essential for making strategic decisions. With Power BI, a leading tool for data analysis and visualization, you can turn complex data into clear and actionable insights.
This training provides you with the skills to:
- Collect, transform, and load data into Power BI.
- Design visually appealing and informative reports that add business value.
- Create dynamic dashboards that provide stakeholders with real-time insights.
- Perform data analysis using DAX (Data Analysis Expressions) and other advanced Power BI features.
The course focuses not only on technical aspects, but also on developing effective reporting strategies aligned with business goals.
Who should take this course?
This training is designed for:
- Data Analysts who want to use Power BI to visualize data and create reports.
- Business Intelligence Professionals who aim to implement reporting tools for better decision-making.
- Business Decision-Makers who want to extract insights from company data to develop strategic plans.
- IT Professionals who manage and optimize reporting systems.
- Beginners who want to build a solid foundation in Power BI for business reporting.
Whether you're a beginner or an experienced professional, this course offers valuable insights and practical knowledge.
Course content
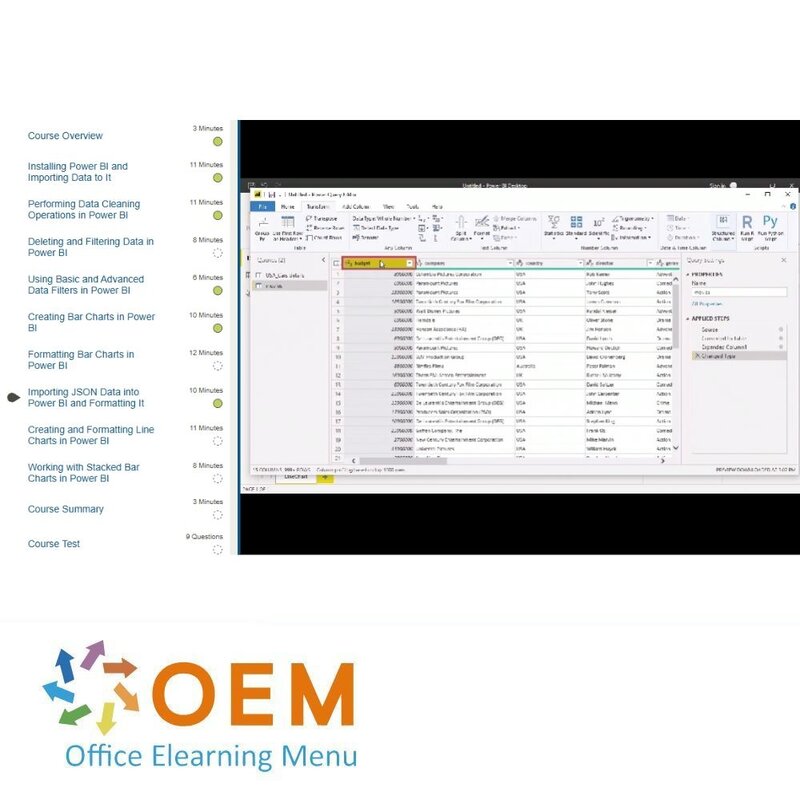
Business Reporting: Getting Started with Power BI Desktop for Data Analysis
Course: 1 Hour, 32 Minutes
- Course Overview
- Installing Power BI and Importing Data to It
- Performing Data Cleaning Operations in Power BI
- Deleting and Filtering Data in Power BI
- Using Basic and Advanced Data Filters in Power BI
- Creating Bar Charts in Power BI
- Formatting Bar Charts in Power BI
- Importing JSON Data into Power BI and Formatting It
- Creating and Formatting Line Charts in Power BI
- Working with Stacked Bar Charts in Power BI
- Course Summary
Business Reporting: Visualizing & Merging Data in Power BI
Course: 1 Hour, 26 Minutes
- Course Overview
- Creating Calculated Columns in Power Query
- Power BI: Importing and Cleaning XML Data
- Creating Stacked Line Charts in Power BI
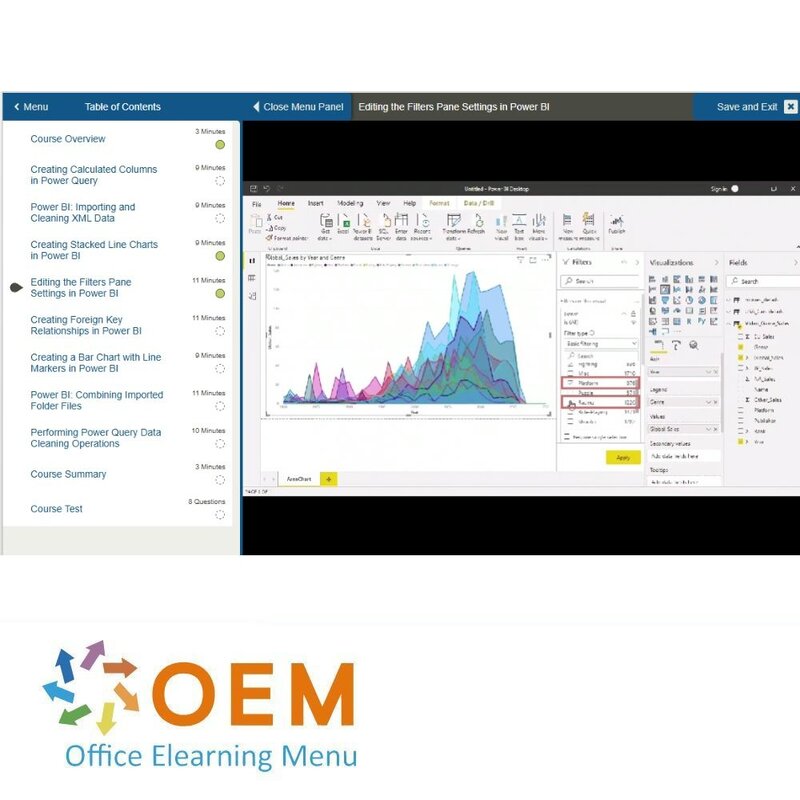
- Editing the Filters Pane Settings in Power BI
- Creating Foreign Key Relationships in Power BI
- Creating a Bar Chart with Line Markers in Power BI
- Power BI: Combining Imported Folder Files
- Performing Power Query Data Cleaning Operations
- Course Summary
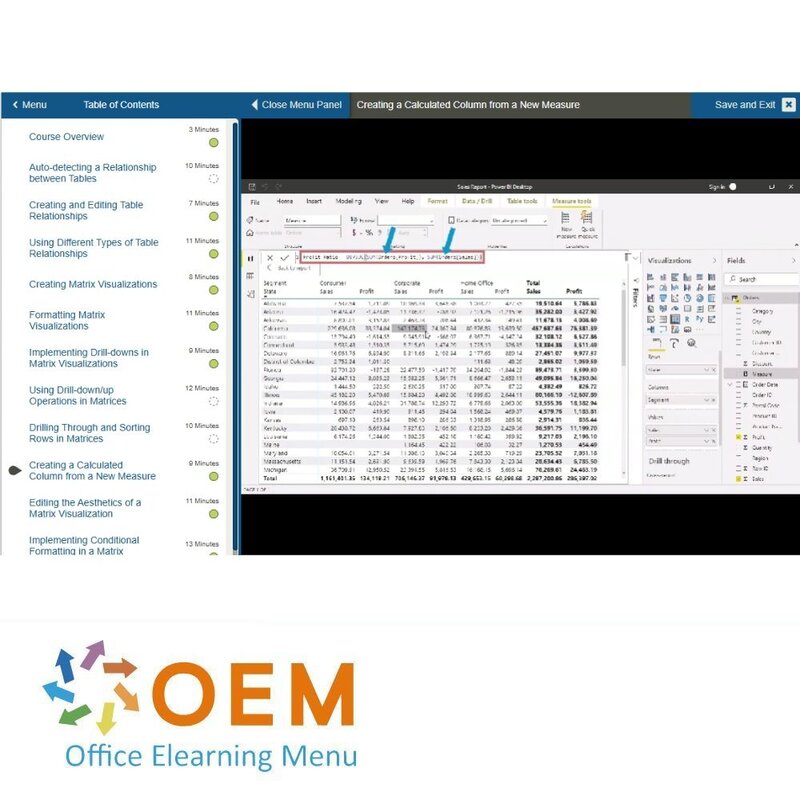
Business Reporting: Creating & Formatting Matrix Visualizations in Power BI
Course: 1 Hour, 57 Minutes
- Course Overview
- Auto-detecting a Relationship between Tables
- Creating and Editing Table Relationships
- Using Different Types of Table Relationships
- Creating Matrix Visualizations
- Formatting Matrix Visualizations
- Implementing Drill-downs in Matrix Visualizations
- Using Drill-down/up Operations in Matrices
- Drilling Through and Sorting Rows in Matrices
- Creating a Calculated Column from a New Measure
- Editing the Aesthetics of a Matrix Visualization
- Implementing Conditional Formatting in a Matrix Visualization
- Course Summary
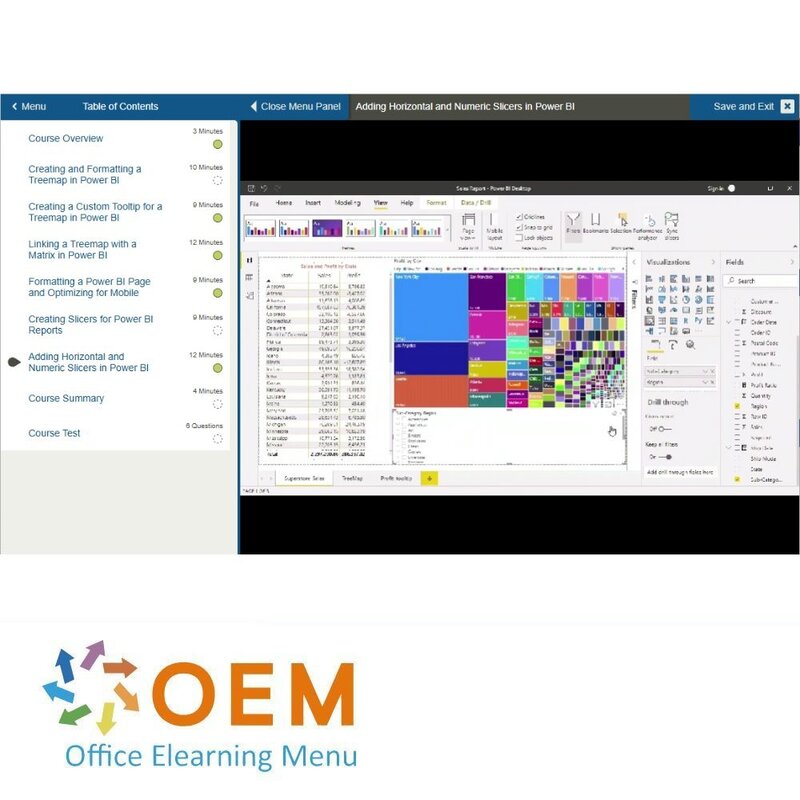
Business Reporting: Leveraging Treemaps, Matrices, & Slicers in Power BI
Course: 1 Hour, 7 Minutes
- Course Overview
- Creating and Formatting a Treemap in Power BI
- Creating a Custom Tooltip for a Treemap in Power BI
- Linking a Treemap with a Matrix in Power BI
- Formatting a Power BI Page and Optimizing for Mobile
- Creating Slicers for Power BI Reports
- Adding Horizontal and Numeric Slicers in Power BI
- Course Summary
What is Power BI?
Power BI is a powerful business intelligence tool developed by Microsoft. It enables users to visualise and analyse data from various sources to gain insights and make informed business decisions. With Power BI, interactive dashboards, reports and data visualisations can be created and shared across an organisation.
Power BI allows users to integrate data from various sources, both locally and in the cloud. It offers built-in data preparation tools, which allow raw data to be transformed and modified. Users can also create relationships between different data tables to make meaningful connections.
An important aspect of Power BI is its ability to present data in a visually appealing and understandable way. It offers a wide range of visual elements, such as charts, tables, maps and custom visuals, to display data in an intuitive way.
In addition, Power BI includes advanced analytics capabilities, such as built-in machine learning algorithms and natural language processing (NLP). This allows users to perform complex analysis, identify patterns and derive insights from the data.
Power BI also supports collaboration and sharing of reports and dashboards. Users can publish and share their results with others within their organisation. In addition, Power BI offers mobile apps for iOS and Android, allowing users to access their reports and dashboards on the go.
Overall, Power BI is designed to provide users with autonomous analysis and data-driven decision-making capabilities. It is a popular choice for businesses of all sizes.
10 benefits of Power BI
- Data visualisation: Power BI offers powerful visualisation capabilities that allow data to be presented in an intuitive and attractive way. This helps in understanding complex data and identifying patterns and trends.
- Interactive dashboards: With Power BI, interactive dashboards can be created, allowing users to quickly and easily navigate through data and view the most relevant information. This enables users to gain real-time insights and make faster decisions.
- Data integration: Power BI can integrate data from different sources, such as databases, spreadsheets and cloud services. This enables users to combine and analyse data from different sources, leading to a more complete picture and better decision-making.
- Self-service analysis: Power BI is designed for self-service analysis, meaning users can perform complex analysis and gain insights without a technical background. This reduces reliance on IT teams and speeds up the analytical process.
- Real-time data: Power BI can update data in real time, meaning users always have access to the most up-to-date information. This is especially useful when monitoring business performance and making decisions based on real-time data.
- Advanced analytics capabilities: Power BI offers advanced analytics capabilities, such as machine learning integration and natural language processing. This enables users to perform complex analysis, build predictive models and extract deeper insights from their data.
- Mobile accessibility: With the Power BI mobile app, users can view and analyse reports and dashboards from their smartphones and tablets. This ensures flexibility and access to data even when users are on the move.
- Collaboration and sharing: Power BI makes collaboration and sharing of data and insights easy. Users can easily share reports and dashboards with colleagues and stakeholders, promoting collaboration and making better decisions based on shared insights.
- Scalability: Power BI is scalable and can be used by individuals, small teams and large organisations. It can be easily adapted to a company's growing needs and supports a large number of users and data sources.
- Integration with other Microsoft tools: Power BI integrates seamlessly with other Microsoft tools, such as Excel, SharePoint and Azure. This provides additional capabilities and makes it easier to leverage existing data sources and workflows.
Why is Power BI important?
Power BI is important because it enables organisations to visualise, analyse data and gain insights for data-driven decision-making. It provides powerful and intuitive tools for data integration, visualisation and analysis, allowing users to quickly and easily access valuable information and gain real-time insights. Power BI also promotes collaboration and data sharing, enabling teams to work together more effectively and make better decisions based on shared insights.
Why OEM Office Elearning Menu?
OEM Office Elearning Menu has years of experience in providing online courses and training. From Excel, Word and Outlook to high professional ICT training for Cisco, AWS, CompTIA and more.
OEM is an official Microsoft Partner, CertiPort Partner and EC-Council Partner. With over 1000 courses from more than 200 brands, our offer is suitable for every PC user. Whether you are a first time PC user starting up Word for the first time, or an ICT professional wanting to know more about Data Security; OEM has the right course or training for you. Missing a training? Let us know and we will gladly look at the options together.
Each completed course provides you with an official certificate of participation. This is personal and specifically addressed to the student. Every Incompany training course automatically delivers a certificate of participation. For each E-learning course you need to have completed at least 70% of the practical assignments to receive a certificate of participation.
OEM - Learn to Work
Choose from 1000+ training courses from 200+ brands for your personal and business development.
An Excel course, Word course or even a full Office course always comes in handy. We deal with Microsoft programs on a daily basis and it will save you a lot of time to master them properly.
We also have training courses for ICT professionals at OEM Office Elearning Menu. For example, you will learn to deal with databases, servers, learn programming or even become a certified ethical hacker. Learn everything online through E-learning, through course books, walk-in trainings or through Incompany trainings within the company you work for.
| Language | English |
|---|---|
| Qualifications of the Instructor | Certified |
| Course Format and Length | Teaching videos with subtitles, interactive elements and assignments and tests |
| Lesson duration | 6:04 Hours |
| Progress monitoring | Yes |
| Access to Material | 365 days |
| Technical Requirements | Computer or mobile device, Stable internet connections Web browsersuch as Chrome, Firefox, Safari or Edge. |
| Support or Assistance | Helpdesk and online knowledge base 24/7 |
| Certification | Certificate of participation in PDF format |
| Price and costs | Course price at no extra cost |
| Cancellation policy and money-back guarantee | We assess this on a case-by-case basis |
| Award Winning E-learning | Yes |
| Tip! | Provide a quiet learning environment, time and motivation, audio equipment such as headphones or speakers for audio, account information such as login details to access the e-learning platform. |
There are no reviews written yet about this product.
OEM Office Elearning Menu Top 2 in ICT-trainingen 2024!
OEM Office Elearning Menu is trots op de tweede plaats in de categorie ICT-trainingen 2024 bij Beste Opleider van Nederland (Springest/Archipel). Dank aan al onze cursisten voor hun vertrouwen!
Reviews
There are no reviews written yet about this product.


