Data Analysis with R Training


Data Analysis with R Training
Data Analysis with R E-Learning Training Certified Teachers Exam Quizzes Assessments Test Exam Live Labs Tips Tricks Certificate.
Read more- Discounts:
-
- Buy 2 for €292,04 each and save 2%
- Buy 3 for €289,06 each and save 3%
- Buy 4 for €286,08 each and save 4%
- Buy 5 for €283,10 each and save 5%
- Buy 10 for €268,20 each and save 10%
- Buy 25 for €253,30 each and save 15%
- Buy 50 for €238,40 each and save 20%
- Availability:
- In stock
- Delivery time:
- Ordered before 5 p.m.! Start today.
- Award Winning E-learning
- Lowest price guarantee
- Personalized service by our expert team
- Pay safely online or by invoice
- Order and start within 24 hours


Data Analysis with R E-Learning
Master data analysis and statistical modeling using the power of R.
R is a globally recognized programming language used for statistical computing, data analysis, and data mining. In this hands-on course, you'll learn the fundamentals of R, how to work with datasets, and apply statistical concepts to perform insightful analysis and modeling.
What you’ll learn:
- R language fundamentals: syntax, variables, functions, and structures
- Data exploration and cleaning using real-world datasets in R
- Apply statistical techniques like mean, variance, and correlation
- Build models using regression and clustering
- Use R for reporting and visualization
This course is part of an Agile Learning Kit, providing step-by-step learning with labs, mentoring, and 365-day access.
Why Choose This Training?
- Gain practical skills in statistical analysis with R
- Learn by doing with applied data problems
- Includes e-learning, practice labs, mentor support & assessments
- Agile structure ensures progressive and manageable learning
- Full access to all resources for 365 days
Who Should Enroll?
This course is perfect for:
- Data analysts and researchers starting with R
- Students in statistics, data science, or economics
- Professionals looking to analyze data with open-source tools
- Academics and scientists needing structured analysis workflows
This Learning Kit with more than 26 hours of learning is divided into three tracks:
Course content
Module 1: Getting Started with R Programming
In this module, the focus will be on R programming for beginners. Explore the basics of R.
Courses (6 hours +):
R Programming for Beginners: Getting Started
Course: 1 Hour, 31 Minutes
- Course Overview
- Installing R on macOS
- Installing R on Windows
- Using the ? Operator in R
- Using help() and Creating Variables in R
- Using Reserved Words and Assignment Operators in R
- Using Vectors in R
- Performing Arithmetic Operations in R
- Creating Variables in R
- Using the Built-in Functions of R
- Using the Numeric Built-in Functions of R
- Recognizing the Basic Data Types in R
- Course Summary
R Programming for Beginners: Exploring R Vectors
Course: 1 Hour, 28 Minutes
- Course Overview
- Creating Basic R Vectors
- Understanding the Finer Points of R Vectors
- Indexing into R Vectors
- Performing Vectorized Operations in R
- Implementing Relational Operations on R Vectors
- Creating R Vectors with Key-Value Pairs
- Recycling R Vectors in Vectorized Operations
- Filtering Data in R Vectors
- Using any(), all(), & which() Functions on R Vectors
- Course Summary
R Programming for Beginners: Leveraging R with Matrices, Arrays, & Lists
Course: 1 Hour, 36 Minutes
- Course Overview
- Creating Matrices in R
- Naming Dimensions in R Matrices
- Performing Math Operations on R Matrices
- Implementing Matrix Multiplication in R
- Combining Matrices in R
- Performing Indexing Operations on R Matrices
- Creating Arrays in R
- Indexing into R Arrays
- Using Lists in R
- Specifying Key-Value Pairs in R Lists
- Editing Keys and Values in R Lists
- Exploring R Lists with Different Data Types
- Course Summary
R Programming for Beginners: Understanding Data Frames, Factors, & Strings
Course: 1 Hour, 53 Minutes
- Course Overview
- Creating R Data Frames
- Naming R Data Frame Dimensions & Viewing Statistics
- Indexing into R Data Frames
- Filtering Data in R Data Frames
- Combining R Data Frames
- Joining R Data Frames
- Using Factors in R to Limit Variable Values
- Creating R Data Frames with Factors
- Using Factors with tapply() and split() in R
- Viewing Counts Using Tables in R
- Working with Strings in R
- Using formatC() & sprintf() in R
- Course Summary
Assessment:
Getting Started with R Programming
Module 2: Applying and Using R Programming Structures
In this module, the focus will be on R programming structures. Explore control flow, functions, and object systems.
Courses (4 hours +)
Using R Programming Structures: Leveraging R with Control Flow & Looping
Course: 1 Hour, 13 Minutes
- Course Overview
- Conditional Branching with If Statements in R
- Using ifelse() and the Switch Statement in R
- Iterating over Data with For Loops in R
- Iterating over R Lists and Matrices with For Loops
- Using Nested For Loops in R
- Using While Loops in R
- Using Repeat Loops in R
- Performing Advanced Looping in R
- Course Summary
Using R Programming Structures: Functions & Environments
Course: 1 Hour, 41 Minutes
- Course Overview
- Creating Custom Functions in R
- Returning Data from Functions in R
- Using Named Arguments in R
- Using Default Arguments in R
- Working with First-class Functions in R
- Storing Functions & Using Them in Switch Statements
- Working with R Environments
- Creating Inner Functions in R
- Recognizing R Functions and Environments
- Working with Closures in R
- Working with Replacement Functions in R
- Course Summary
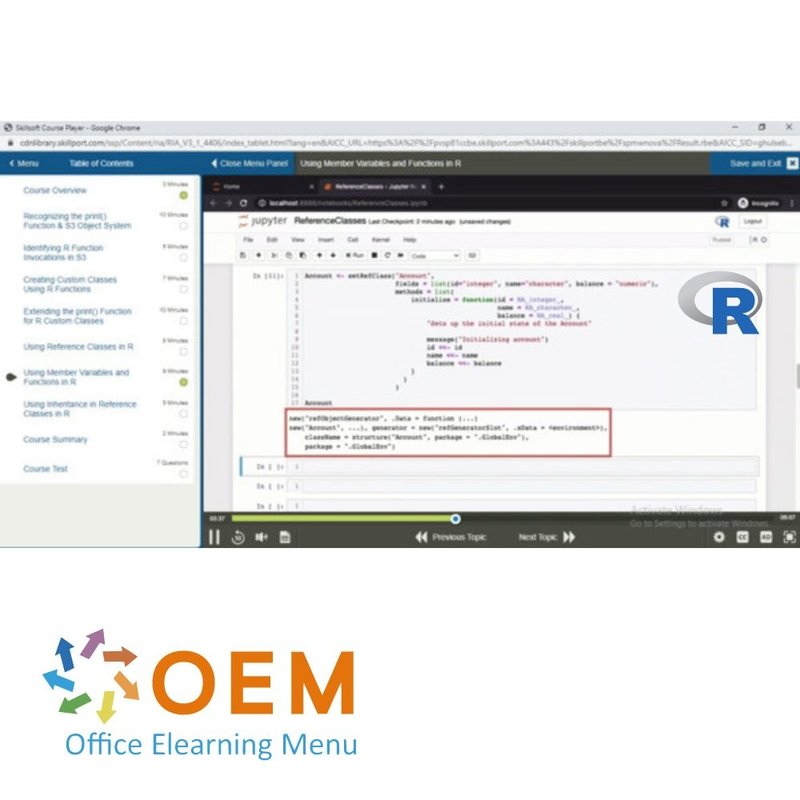
Using R Programming Structures: Object Systems
Course: 59 Minutes
- Course Overview
- Recognizing the print() Function & S3 Object System
- Identifying R Function Invocations in S
- Creating Custom Classes Using R Functions
- Extending the print() Function for R Custom Classes
- Using Reference Classes in R
- Using Member Variables and Functions in R
- Using Inheritance in Reference Classes in R
- Course Summary
Assessment:
Applying and Using R Programming Structures
Module 3: Working with Datasets In R
In this module, the focus will be on R datasets. Explore how to load, save, and transform data as well as select, filter, join, and visualize data.
Courses (6 hours +)
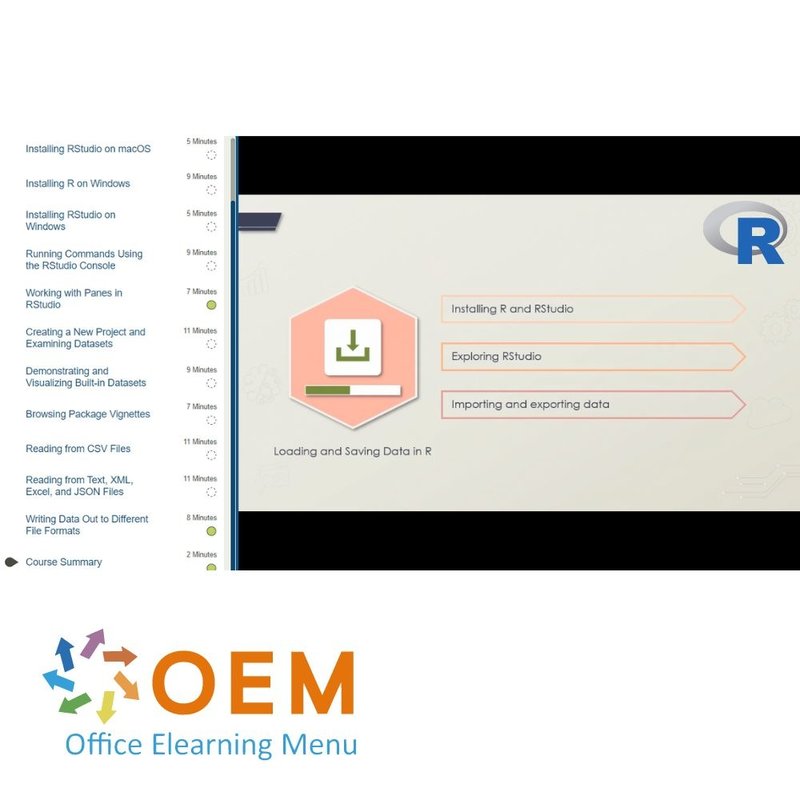
Datasets in R: Loading & Saving Data
Course: 1 Hour, 44 Minutes
- Course Overview
- Installing R on macOS
- Installing RStudio on macOS
- Installing R on Windows
- Installing RStudio on Windows
- Running Commands Using the RStudio Console
- Working with Panes in RStudio
- Creating a New Project and Examining Datasets
- Demonstrating and Visualizing Built-in Datasets
- Browsing Package Vignettes
- Reading from CSV Files
- Reading from Text, XML, Excel, and JSON Files
- Writing Data Out to Different File Formats
- Course Summary
Datasets in R: Transforming Data
Course: 1 Hour, 59 Minutes
- Course Overview
- Working with an In-memory SQLite Table
- Connecting to and Retrieving Results from SQLite
- Updating Results with a Persistent Database
- Dropping and Renaming Columns
- Changing Column Data Types
- Transforming Data Using the Transform Function
- Transforming Data Using the Apply Function Family
- Transforming Data Using if_else() and mutate()
- Wide Form and Long Form: Using stack() and unstack()
- Wide Form and Long Form: Using melt() and dcast()
- melt() and dcast() on a Real Dataset
- Wide Form and Long Form: Using gather() and spread()
- Course Summary
Datasets in R: Selecting, Filtering, Ordering, & Grouping Data
Course: 1 Hour, 35 Minutes
- Course Overview
- Formatting Columns to Have the Right Data Type
- Selecting Specific Rows and Columns
- Filtering Operations on Data Frame Rows
- Selecting and Filtering Using Packages in tidyverse
- Using the dplyr filter() Function
- Retrieving Samples and Top N Results
- Specifying the Correct Data Types for Columns
- Sorting Using Order and Arrange
- Grouping and Aggregations on Data Frames
- Grouping and Aggregation Using dplyr
- Course Summary
Datasets in R: Joining & Visualizing Data
Course: 47 Minutes
- Course Overview
- Joining Data Frames Using merge()
- Joining Tibbles Using Joins and Filtering Joins
- Creating Histograms and Density Curves
- Using Plots and Charts to Visualize Data
- Course Summary
Assessment:
Working with Datasets in R
Module 4: Statistical Analysis and Modeling In R
In this module, the focus will be on statistical analysis and modeling in R. Explore probability distributions, statistical tests, regression analysis, clustering, and regularized models.
Courses (9 hours +)
Statistical Analysis and Modeling in R: Working with Probability Distributions
Course: 1 Hour, 38 Minutes
- Course Overview
- Statistical Tools for Understanding Data
- Population and Sample Metric Comparisons
- Characteristics of Probability Distribution Types
- Sampling and Analyzing Uniform Distribution Data
- Sampling and Analyzing Binomial Distribution Data
- Computing Probabilities in Binomial Distributions
- Sampling and Analyzing Poisson Distribution Data
- Examining Normal and Exponential Distributions
- Interpreting QQ Plots Using R
- Using QQ Plots in R to Compare Datasets
- Course Summary
Statistical Analysis and Modeling in R: Understanding & Interpreting Statistical Tests
Course: 1 Hour, 4 Minutes
- Course Overview
- Statistical Tools for Understanding Data
- Population and Sample Metric Comparisons
- Characteristics of Probability Distribution Types
- Sampling and Analyzing Uniform Distribution Data
- Sampling and Analyzing Binomial Distribution Data
- Computing Probabilities in Binomial Distributions
- Sampling and Analyzing Poisson Distribution Data
- Examining Normal and Exponential Distributions
- Interpreting QQ Plots Using R
- Using QQ Plots in R to Compare Datasets
- Course Summary
Statistical Analysis and Modeling in R: Statistical Analysis on Your Data
Course: 2 Hours, 7 Minutes
- Course Overview
- Identifying One-sample T-test Assumptions
- Performing the One-sample T-test in R
- Performing Variations of the One-sample T-test in R
- Performing the One-sample Z-test in R
- Identifying Assumptions of the Two-sample T-test
- Running Two-sample T-tests for Equal Variances in R
- Using Welch's two-sample T-test for Unequal Variance
- Using R to Perform the Paired Samples T-test
- Checking Paired Samples T-test Assumptions Using R
- Performing the Wilcoxon Signed-rank Test Using R
- Identifying Assumptions of the ANOVA Test Using R
- Running the One-way ANOVA and Tukey HSD Tests in R
- Running the Two-way ANOVA Test for Different Models
- Parametric vs. Non-parametric Tests
- Course Summary
Statistical Analysis and Modeling in R: Performing Regression Analysis
Course: 1 Hour
- Course Overview
- The Basic Characteristics of Machine Learning Models
- Building and Evaluating Regression Models Using R
- Visualizing Data Relationships Using R
- Performing Simple Linear Regression in R
- Performing Multiple Regression in R
- Deriving Predictions Using Regression Models in R
- Building Regression Models Using Cross-validation
- Course Summary
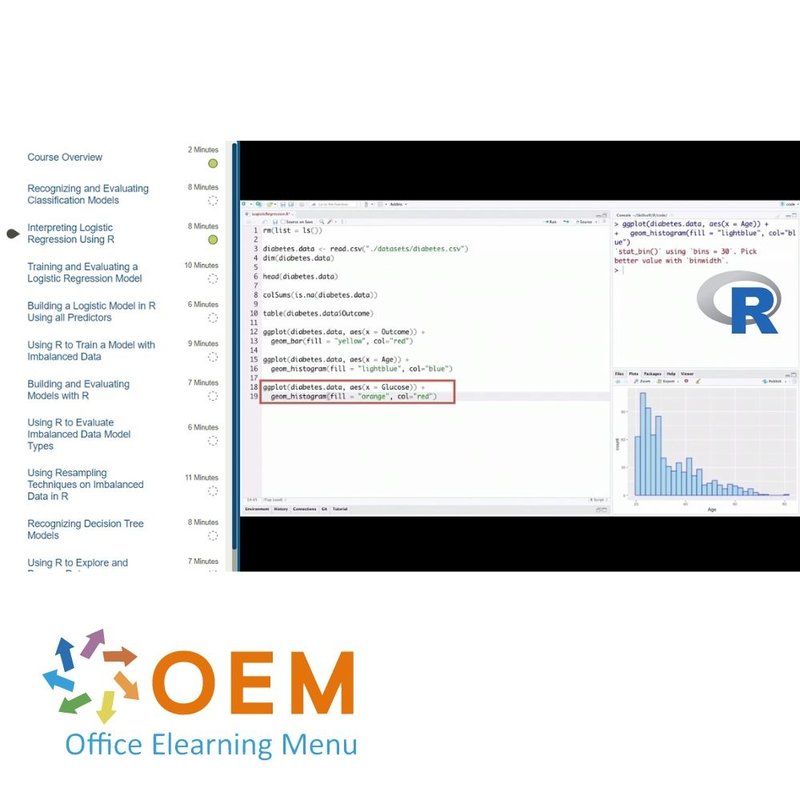
Statistical Analysis and Modeling in R: Performing Classification
Course: 1 Hour, 37 Minutes
- Course Overview
- Recognizing and Evaluating Classification Models
- Interpreting Logistic Regression Using R
- Training and Evaluating a Logistic Regression Model
- Building a Logistic Model in R Using all Predictors
- Using R to Train a Model with Imbalanced Data
- Building and Evaluating Models with R
- Using R to Evaluate Imbalanced Data Model Types
- Using Resampling Techniques on Imbalanced Data in R
- Recognizing Decision Tree Models
- Using R to Explore and Process Data
- Visualizing Decision Trees and Performing Prediction
- Course Summary
Statistical Analysis and Modeling in R: Performing Clustering
Course: 50 Minutes
- Course Overview
- Recognizing and Evaluating Clustering Models
- Investigating and Visualizing Clustering Data in R
- Performing K-means Clustering, Interpreting Results
- Using R to Find the Optimal Number of Clusters
- Using K-means Clustering on Multi-attribute Data
- Course Summary
Statistical Analysis and Modeling in R: Building Regularized Models & Ensemble Models
Course: 1 Hour, 32 Minutes
- Course Overview
- Overfitting and Underfitting Machine Learning Models
- The Bias-Variance Trade-off
- Exploring and Understanding Data for Regression
- Performing Ordinary Least Squares (OLS) Regression
- Preparing Data for Regularized Regression Models
- Performing Ridge Regression in R
- Performing Lasso Regression in R
- Performing ElasticNet Regression in R
- Recognizing Ensemble Learning
- Using R to Explore and Visualize Data
- Performing Regression Using Decision Trees in R
- Performing Regression Using Random Forest in R
- Course Summary
Assessment:
Statistical Analysis and Modeling in R
Practice Lab: Data Science Using R
The Data Science Using R Lab will provide you with the necessary platform to gain hands on skills where you can practice different tasks related to MongoDB. You will cover areas like manipulating a data set using multiple dplyr verbs, adding the browser function to some R code to debug it, using xtable to output a table in LaTeX format, and creating an R Markdown file (.rmd) and rendering the output as html.
| Language | English |
|---|---|
| Qualifications of the Instructor | Certified |
| Course Format and Length | Teaching videos with subtitles, interactive elements and assignments and tests |
| Lesson duration | 26 Hours |
| Assesments | The assessment tests your knowledge and application skills of the topics in the learning pathway. It is available 365 days after activation. |
| Online Virtuele labs | Receive 12 months of access to virtual labs corresponding to traditional course configuration. Active for 365 days after activation, availability varies by Training |
| Online mentor | You will have 24/7 access to an online mentor for all your specific technical questions on the study topic. The online mentor is available 365 days after activation, depending on the chosen Learning Kit. |
| Progress monitoring | Yes |
| Access to Material | 365 days |
| Technical Requirements | Computer or mobile device, Stable internet connections Web browsersuch as Chrome, Firefox, Safari or Edge. |
| Support or Assistance | Helpdesk and online knowledge base 24/7 |
| Certification | Certificate of participation in PDF format |
| Price and costs | Course price at no extra cost |
| Cancellation policy and money-back guarantee | We assess this on a case-by-case basis |
| Award Winning E-learning | Yes |
| Tip! | Provide a quiet learning environment, time and motivation, audio equipment such as headphones or speakers for audio, account information such as login details to access the e-learning platform. |
There are no reviews written yet about this product.
OEM Office Elearning Menu Top 2 in ICT-trainingen 2024!
OEM Office Elearning Menu is trots op de tweede plaats in de categorie ICT-trainingen 2024 bij Beste Opleider van Nederland (Springest/Archipel). Dank aan al onze cursisten voor hun vertrouwen!
Reviews
There are no reviews written yet about this product.


