Data Visualization with Bokeh and Plotly Training
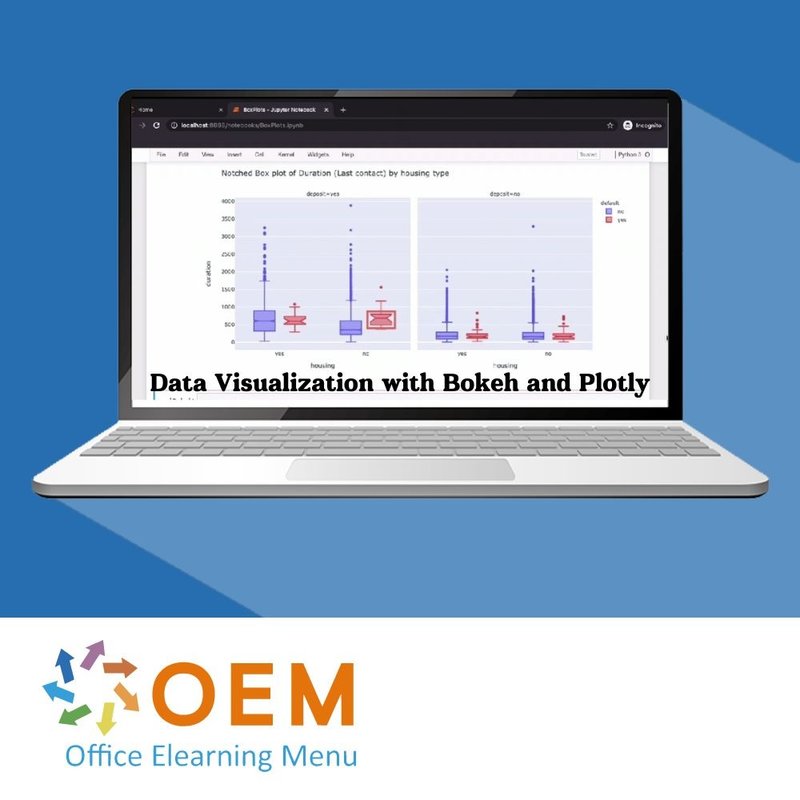


Data Visualization with Bokeh and Plotly Training
Data Visualization with Bokeh and Plotly E-Learning Training Certified Teachers Exam Quizzes Assessments Test Exam Live Labs Tips Tricks Certificate.
Read more- Discounts:
-
- Buy 2 for €155,82 each and save 2%
- Buy 3 for €154,23 each and save 3%
- Buy 4 for €152,64 each and save 4%
- Buy 5 for €151,05 each and save 5%
- Buy 10 for €143,10 each and save 10%
- Buy 25 for €135,15 each and save 15%
- Buy 50 for €127,20 each and save 20%
- Availability:
- In stock
- Delivery time:
- Ordered before 5 p.m.! Start today.
- Award Winning E-learning
- Lowest price guarantee
- Personalized service by our expert team
- Pay safely online or by invoice
- Order and start within 24 hours


Data Visualization with Bokeh and Plotly E-Learning
Order this unique E-Learning course Data Visualization with Bokeh and Plotly online!
✔️ 1 year 24/7 access to interactive videos, voice support, progress monitoring through reports and tests per chapter to immediately test your knowledge.
Why choose this course?
This course provides a detailed introduction to two powerful Python libraries for data visualization: Bokeh and Plotly. These tools help you create dynamic, interactive, and visually appealing charts and dashboards that improve data communication and enable powerful insights.
What you will learn:
- Introduction to Bokeh and Plotly: Learn the basics of both libraries, how they work and what they are best used for.
- Data analysis and visualization: Discover how to efficiently load and visualize data in different formats such as graphs, maps, and interactive dashboards.
- Interactivity in visualizations: Create interactive elements such as sliders, buttons, and menus so that users can interact with the visualizations dynamically.
- Integration with web applications: Learn how to integrate Bokeh and Plotly visualizations into web applications to make your data more accessible.
- Advanced visualization techniques: Develop complex graphs such as 3D visualizations, time series, and geospatial visualizations.
- Practical examples and case studies: Learn how to use the tools to solve real-world data analysis problems and create interactive dashboards for decision-making.
By taking this course, you'll learn how to create powerful and easy-to-use visualizations with Python, taking data communications to the next level.
Who should participate?
This course is suitable for:
- Data analysts and scientists who want to learn how to present data in an interactive and visually appealing way.
- Python developers who want to expand their knowledge of data analysis by using visualization tools such as Bokeh and Plotly.
- Business Intelligence professionals who need visual reports to support decisions.
- Engineers and researchers who want to visualize and share scientific data with a broader audience.
- Students and beginners who are interested in data analysis and want to learn how to create professional visualizations with Python.
- Marketing and sales teams looking to create insights by presenting data in a visual way.
If you're interested in improving your data visualization skills using the latest Python tools, this course is for you!
Course content
Data Visualization: Building Interactive Visualizations with Bokeh
Course: 1 Hour, 6 Minutes
- Course Overview
- Installing Bokeh
- Saving Bokeh Charts as PNG and HTML Files
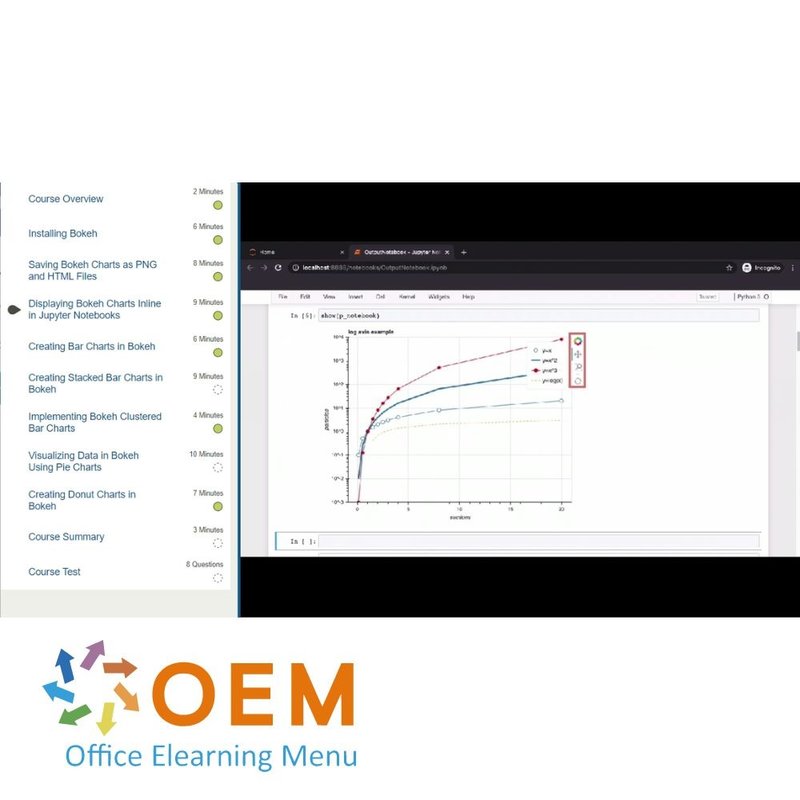
- Displaying Bokeh Charts Inline in Jupyter Notebooks
- Creating Bar Charts in Bokeh
- Creating Stacked Bar Charts in Bokeh
- Implementing Bokeh Clustered Bar Charts
- Visualizing Data in Bokeh Using Pie Charts
- Creating Donut Charts in Bokeh
- Course Summary
Data Visualization: More Specialized Visualizations in Bokeh
Course: 1 Hour, 8 Minutes
- Course Overview
- Creating Scatter Plots Using Bokeh
- Visualizing Relationships with Bokeh Scatter Plots
- Customizing Scatter Plots in Bokeh
- Visualizing Data Using Bokeh Heatmaps
- Creating Line Charts in Bokeh
- Customizing Line Charts with Area Charts in Bokeh
- Visualizing Data Using Bokeh Network Charts
- Course Summary
Data Visualization: Getting Started with Plotly
Course: 1 Hour, 9 Minutes
- Course Overview
- Installing Plotly
- Components of Plotly Graphs
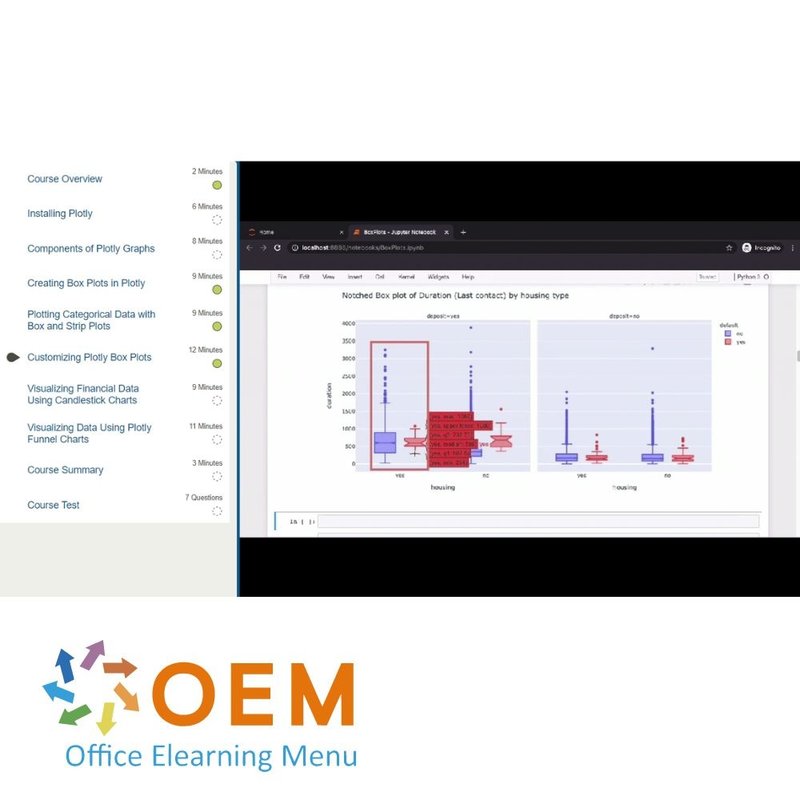
- Creating Box Plots in Plotly
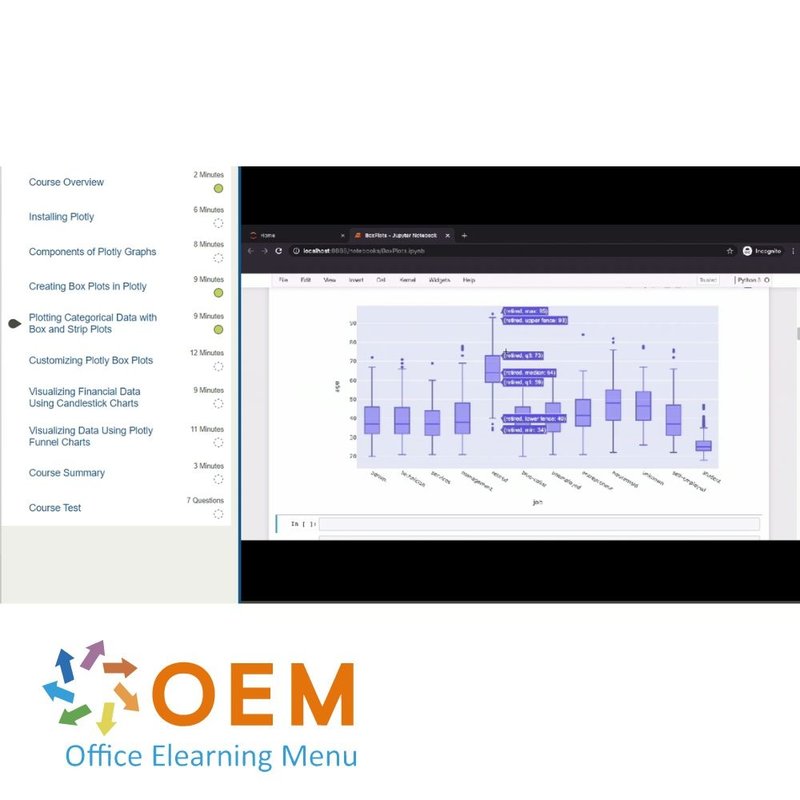
- Plotting Categorical Data with Box and Strip Plots
- Customizing Plotly Box Plots
- Visualizing Financial Data Using Candlestick Charts
- Visualizing Data Using Plotly Funnel Charts
- Course Summary
Data Visualization: Visualizing Data Using Advanced Charts in Plotly
Course: 1 Hour, 10 Minutes
- Course Overview
- Creating Radar Charts in Plotly
- Components of Plotly Radar Charts
- Visualizing Hierarchical Data Using Sunburst Charts
- Visualizing Schedules in Plotly Using Gantt Charts
- Creating Sankey Diagrams in Plotly
- Visualizing Data Using Plotly Sankey Diagrams
- Visualizing Geographical Data Using Plotly Maps
- Course Summary
Start your journey in data analysis and visualization today!
✔️ Flexible learning: Study the course at your own pace with rich interactive videos and voice support.
✔️ Immediately applicable knowledge: Test your progress with quizzes and practical assignments to immediately apply your new skills.
✔️ Certificate of Participation: Receive a Certificate of Participation after completing the course.
✔️ Create interactive visualizations: Learn how to create powerful visualizations that improve decision-making and strengthen your data communications.
Order your course now and become an expert in data analysis and visualization with Bokeh and Plotly!
| Language | English |
|---|---|
| Qualifications of the Instructor | Certified |
| Course Format and Length | Teaching videos with subtitles, interactive elements and assignments and tests |
| Lesson duration | 4:33 Hours |
| Progress monitoring | Yes |
| Access to Material | 365 days |
| Technical Requirements | Computer or mobile device, Stable internet connections Web browsersuch as Chrome, Firefox, Safari or Edge. |
| Support or Assistance | Helpdesk and online knowledge base 24/7 |
| Certification | Certificate of participation in PDF format |
| Price and costs | Course price at no extra cost |
| Cancellation policy and money-back guarantee | We assess this on a case-by-case basis |
| Award Winning E-learning | Yes |
| Tip! | Provide a quiet learning environment, time and motivation, audio equipment such as headphones or speakers for audio, account information such as login details to access the e-learning platform. |
There are no reviews written yet about this product.
OEM Office Elearning Menu Top 2 in ICT-trainingen 2024!
OEM Office Elearning Menu is trots op de tweede plaats in de categorie ICT-trainingen 2024 bij Beste Opleider van Nederland (Springest/Archipel). Dank aan al onze cursisten voor hun vertrouwen!
Reviews
There are no reviews written yet about this product.


